


Container Trade Hits Record 17.3m TEU as Far East Exports Surge
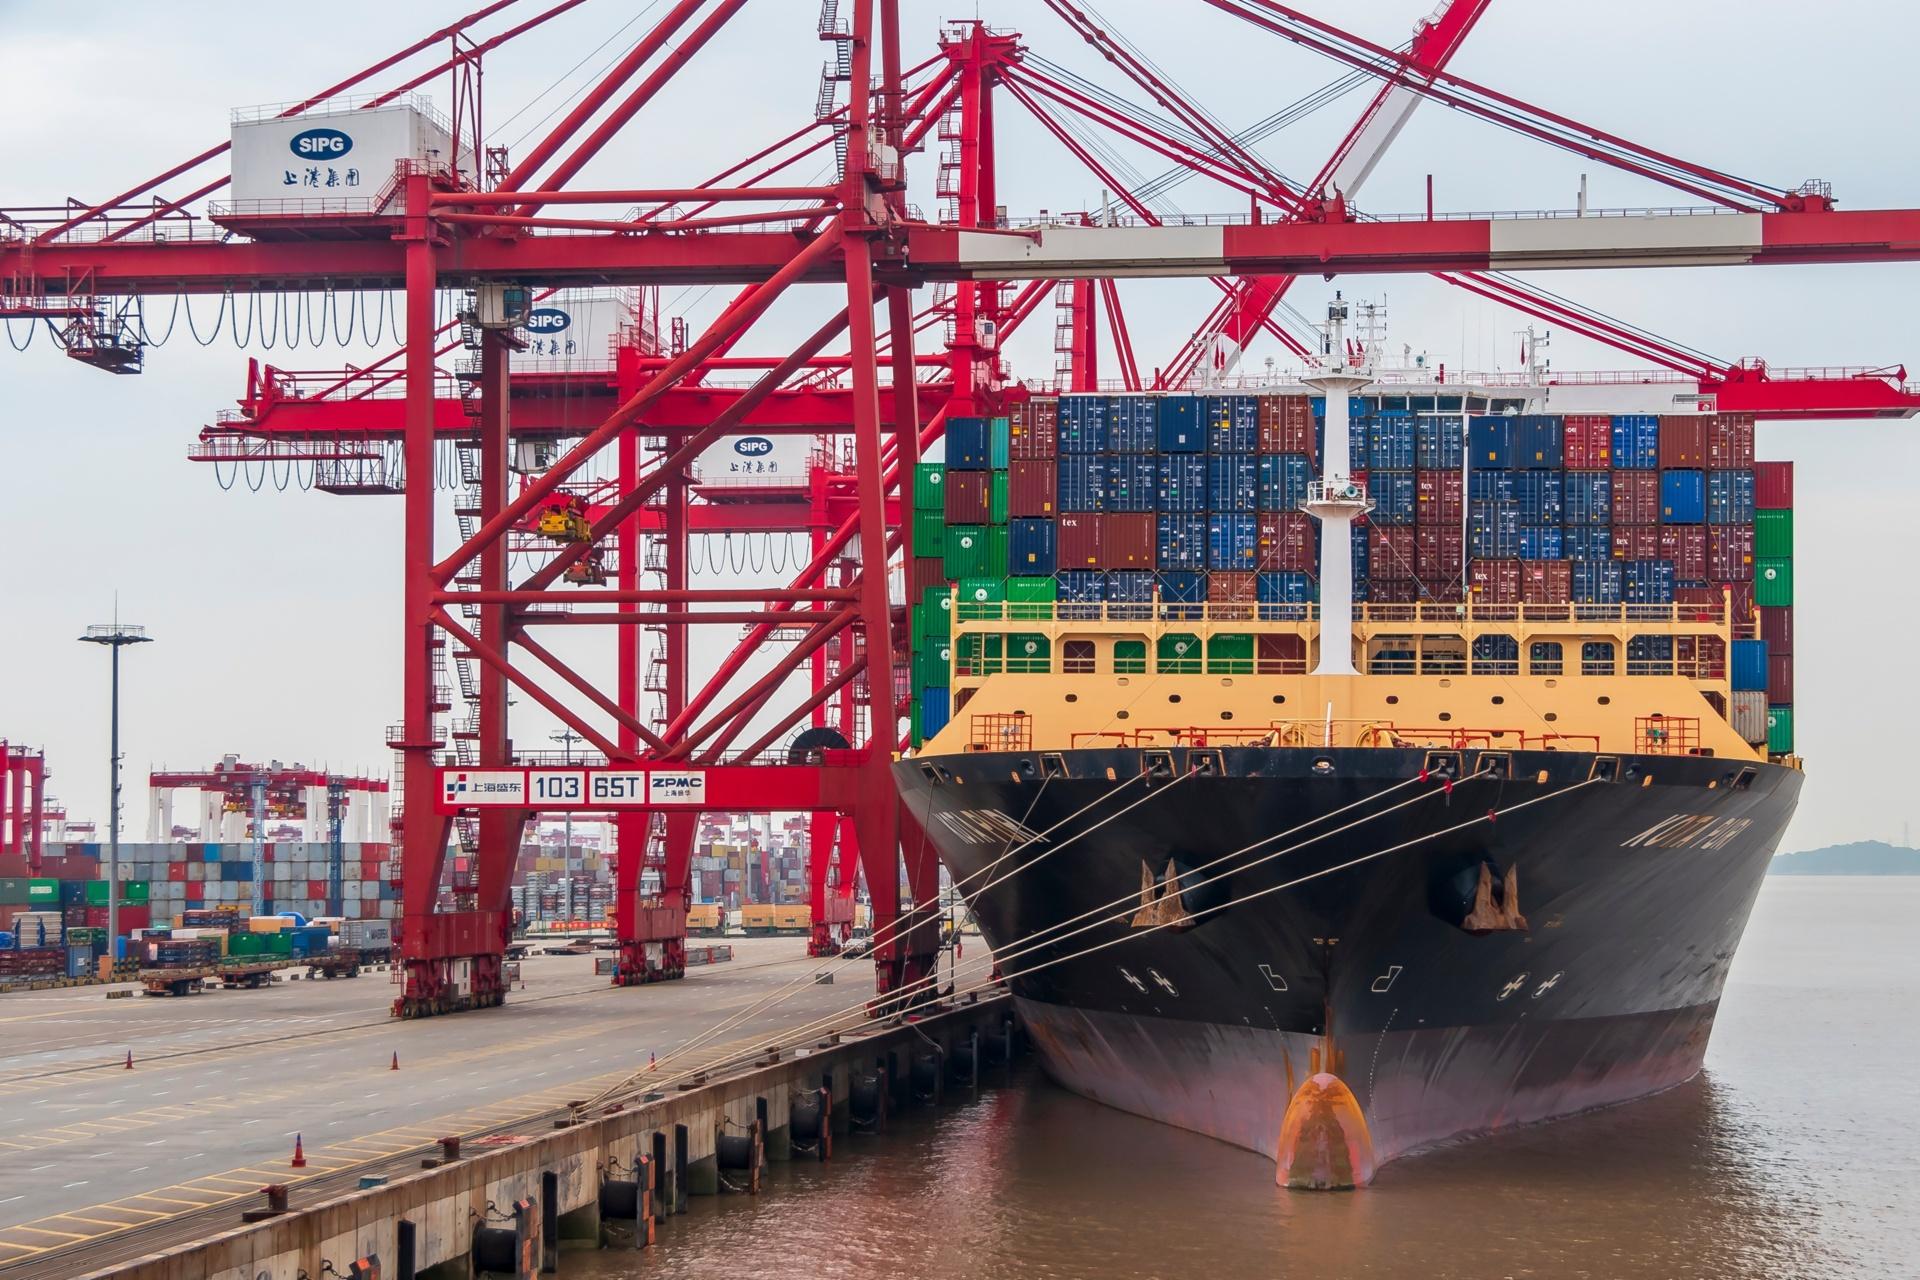

Global container volumes reached a record 17.3 million TEU in July while the CTS Global Price Index climbed 47% from the start of the year. The unusual combination of record cargo demand and elevated transport prices is being sustained by strong Far East exports and disruption to effective vessel capacity — even as the global containership fleet approaches 34 million TEU.
Global container trade has set another record, complicating expectations that a historic wave of new vessel deliveries would quickly tip the liner market into oversupply.
Worldwide container liftings reached 17.3 million TEU in July 2026, the highest monthly figure in the Container Trades Statistics (CTS) database following revisions. Volumes were 4.5% higher year on year, while global traffic during the first seven months of the year increased 5.1% compared with the same period in 2025.
The demand record has come with another striking development: freight costs remain elevated. The CTS Global Price Index reached 115 points in July, seven points higher than in June, about 47% above its level at the start of the year and 37% higher year on year. It was the highest reading since August 2024.
That does not mean every spot market was still rising at the end of July. Instead, the data points to a more complex market in which record cargo volumes, longer voyage requirements, network disruption and capacity management have combined to keep overall transport prices high despite rapid fleet expansion.
Far East exports are driving the growth
The strongest growth signal is coming from the Far East.
CTS data show that Far East exports increased by almost 9% during the first seven months of 2026, adding nearly 6 million TEU compared with the same period last year. Cargo originating in the region increased to every major destination market.
Europe has been one of the most important destinations. European container imports rose 6.1% year to date, with cargo from the Far East accounting for approximately 1.5 million TEU of additional volume.
Sub-Saharan Africa expanded even faster. Imports into the region increased 14%, with the Far East contributing almost 700,000 additional TEU.
The geographical definition matters. CTS reports the increase as Far East traffic rather than China-only exports, meaning the nearly 6 million TEU increase should not be attributed entirely to China.
Nevertheless, Chinese port and export data provide strong evidence that China is an important part of the expansion.
Shanghai International Port Group, operator of the world's largest container port, estimated that its home-port container throughput reached 28.737 million TEU in the first half of 2026, up 6.2% year on year. Shanghai also handled a record 187,312 TEU in a single day on June 9.
The strength of Far East exports is therefore not simply a statistical anomaly. It is being reflected in higher cargo flows through some of Asia's largest gateways.
High CTS prices do not mean spot rates kept rising
The simultaneous rise in volumes and the CTS Global Price Index creates an apparent "volume-and-price" boom, but the price measure requires careful interpretation.
CTS calculates its indices from actual sea freight rate data contributed by container lines. The indices cover quay-to-quay transport costs and include basic ocean freight as well as bunker adjustment factors, congestion surcharges, terminal handling charges, EU Emissions Trading System costs and other charges related to the sea leg.
CTS documentation also shows that the indices cover both spot and contract rate types, measuring changes in the weighted average sea freight rate per TEU against a 2008 base of 100.
That makes the CTS measure fundamentally different from a pure spot benchmark such as Drewry's World Container Index or the Shanghai Containerized Freight Index.
The distinction is particularly important in July.
Drewry's WCI rose to $4,639 per 40-foot container on July 9, its highest level since September 2024. Shanghai-Los Angeles spot rates stood at $6,482 per 40-foot container at that point.
But the market subsequently softened. By July 30, the WCI had fallen for a third consecutive week to $4,255 per 40-foot container, while Shanghai-Los Angeles rates had declined to $5,739. Drewry attributed the weekly decline partly to lower Asia-Europe and transpacific rates.
China's export freight market showed a similar pattern. Official Chinese market analysis put the average July Shanghai-Europe spot rate at $3,232 per TEU, up 6.2% from June, while noting that booking rates eased from their highs later in the month.
The picture is therefore more nuanced than a straightforward demand-led rate rally.
Cargo volumes were exceptionally strong, while geopolitical disruption, fuel costs, congestion and longer network requirements supported overall transport costs. At the same time, spot prices on several major east-west trades had already started retreating from their July peaks.
A 34m-TEU fleet has not crushed the market — yet
The strength of demand is particularly notable because container shipping is absorbing one of the largest supply expansions in its history.
At the beginning of September, global containership capacity was just 8,000 TEU short of 34 million TEU, according to BIMCO.
Another 46 containerships totalling 286,000 TEU were scheduled for delivery during September, meaning the industry would cross the threshold after only a handful of those vessels entered service.
Reaching 34 million TEU means the fleet will have expanded by 10 million TEU, or 42%, in only five and a half years. The previous 10 million TEU increase — from 14 million to 24 million TEU — took more than twice as long.
On conventional supply-demand arithmetic, that scale of vessel delivery should exert substantial downward pressure on freight rates.
But headline fleet capacity and effective capacity are not the same thing.
When vessels sail longer routes, spend more time waiting at congested ports or operate within networks reshaped by security and canal constraints, each ship completes fewer voyages over a given period. A larger proportion of the nominal fleet is effectively tied up simply maintaining existing weekly services.
This has allowed some of the enormous volume of newly delivered tonnage to be absorbed without producing an immediate collapse in freight markets.
Demand has also moved in the opposite direction from what an oversupply scenario would normally require. Global container volumes increased 5.1% through July, while Far East exports expanded almost 9%.
The result is a container market in which record fleet capacity and record cargo volumes are rising at the same time.
Chinese cars are becoming container cargo
One emerging cargo trend illustrates how the composition of container demand may also be changing.
CTS said stronger European imports from the Far East could partly reflect rising European demand for Chinese-made vehicles. With capacity and cost pressures affecting conventional car-carrier services, some vehicles are increasingly being shipped in containers. CTS did not quantify how much of the additional Far East-Europe cargo came from cars, so the relationship should not be treated as a proven explanation for the full 1.5 million TEU increase.
The underlying shift, however, is already visible in China.
Chinese vehicle exports reached 6.14 million units during the first seven months of 2026, up 66.8% year on year, according to China Association of Automobile Manufacturers figures published by the Ministry of Industry and Information Technology. New-energy vehicle exports more than doubled to 2.909 million units.
COSCO SHIPPING has also demonstrated how container networks can be used as an alternative automotive logistics channel.
Its container shipping operation moved 13,052 Chery vehicles in three batches from Taicang to Europe, using containers and opening a direct transport channel to Vado, Italy. China's State-owned Assets Supervision and Administration Commission said COSCO SHIPPING had expanded such services from individual shipments into more standardised, large-volume automotive export operations.
For the container sector, that matters because cargo traditionally associated with pure car and truck carriers is becoming available, at least in selected cases, to liner and multipurpose networks.
China is particularly well positioned for that shift: it combines the world's largest automobile manufacturing base with massive container port infrastructure and one of the densest liner shipping networks globally.
Effective capacity will be the number to watch
The July record does not mean elevated freight rates can continue indefinitely.
The supply pipeline remains formidable. BIMCO's figures show that the fleet has already expanded at unprecedented speed, while further newbuild deliveries will continue to enter the market. A large-scale normalisation of disrupted shipping routes could also release capacity that is currently absorbed by longer voyages.
If vessel productivity improves while new ships continue arriving, the industry's huge nominal fleet could translate much more directly into available slot capacity — increasing downward pressure on rates.
But the opposite remains possible.
If Far East exports continue growing strongly and disruptions continue to consume ship days, global liner operators could remain able to absorb more capacity than headline fleet figures suggest.
That makes effective vessel supply, rather than the 34 million TEU headline alone, one of the most important indicators for the second half of 2026.
The unusual feature of today's container market is that three records or near-records are coexisting: global cargo volumes are at an all-time high, containership capacity is at an all-time high, and overall transport prices remain historically elevated.
July's 17.3 million TEU record is therefore more than another milestone in global trade.
It shows that the industry's current supply-demand equation is being determined not only by how many ships are afloat, but by where cargo is growing, how vessels are being deployed and how much nominal capacity can actually be converted into usable weekly transport supply.


READ MORE
 Containers
What Kind of Company Is Seaspan Today?
 Containers
With an Orderbook Above 45% of the Fleet, Why Are Container Lines Still Paying Up for Ships?
 Containers
HMM Approves $1.62 Billion Plan to Add 12 Containerships
 Containers
Ningbo Containerized Freight Index Weekly Commentary Freight Rates Continued Their Divergent Trend; Composite Index Edged Up
 Containers
Buy Again! From Ships to Ports: Inside the Maersk Family’s Infrastructure Buying Spree
 Containers
CMA CGM Updates eBL Templates to Clarify Electronic Original Status
 Containers
Bigger Fleets, Wider Networks: China’s Provincial Shipping Companies Step Up Expansion
 Containers
2,824-TEU GFS PRIDE Sinks in Hormuz; All 21 Crew Safe
 Containers
Zhonggu Orders Its First 14,000 TEU Ships as Annual Newbuilding Tally Reaches 20
 Containers