


Volumes Fell 0.9%, Yet Profit Rose 23.3%: T.S. Lines Earns US$233 Million in Six Months
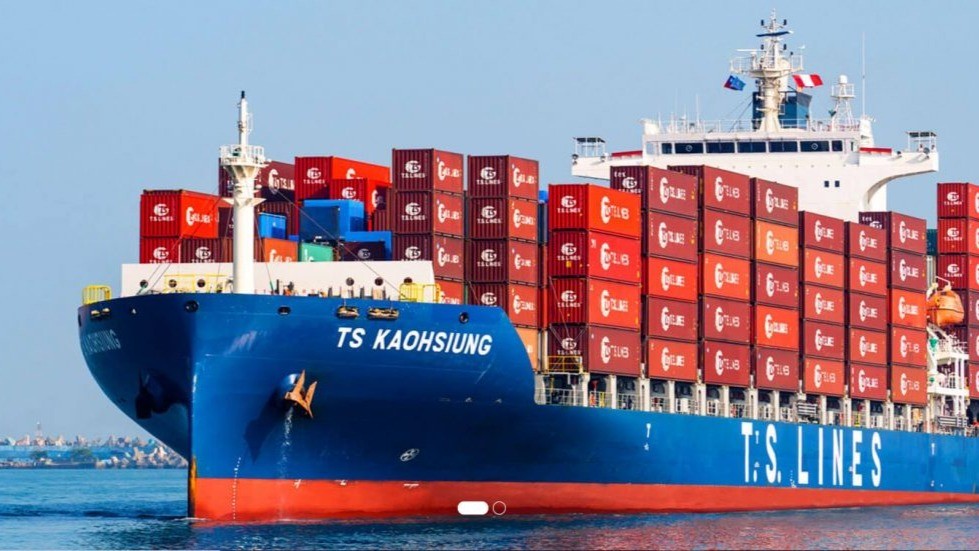
Container volumes declined and revenue increased by only 3%, yet T.S. Lines lifted net profit by more than 23% and gross profit by 31.8%. The Hong Kong-listed carrier’s first-half results show how a regional container line is using a higher proportion of owned tonnage, lower charter and slot costs, and a broader route mix to convert modest top-line growth into much stronger earnings.
According to T.S. Lines’ interim results announcement, revenue for the six months ended June 30, 2026 reached US$660.4 million, up 3.0% year on year. Gross profit rose from US$127.1 million to US$167.5 million, an increase of 31.8%, while profit attributable to equity shareholders climbed 23.3% to US$232.6 million. Basic earnings per share increased from US$0.113 to US$0.140. The board also declared an interim dividend of US$0.070 per share, representing a total distribution of approximately US$116.6 million, or about half of first-half attributable profit.
The growth was achieved despite a decline in liftings. Container volumes fell 0.9% from 818,480 TEU to 810,842 TEU, while average revenue per TEU increased 3.6% from US$715 to US$741. Gross margin consequently widened from 19.8% to 25.4%, a gain of around 5.6 percentage points, while the margin on profit attributable to shareholders rose from 29.4% to 35.2%. The figures point to a shift in operating priorities: extracting more revenue and profit from each slot and each vessel has become at least as important as pursuing volume growth.
Lower charter and slot costs reopened the margin
T.S. Lines reduced cost of sales by 4.2%, from US$514.3 million to US$492.9 million, even as revenue rose by approximately US$19 million. That combination added about US$40.4 million to gross profit and formed the central operating driver of the result. The company attributed the cost reduction mainly to lower vessel charter hire and slot hire expenses, partly offset by higher bunker costs. Marine fuel consumed during the period cost US$96.2 million, up 16.1% from US$82.9 million. Cost of sales still declined despite an increase of more than US$13 million in fuel expenditure, indicating that savings in chartering, purchased slots and fleet deployment were substantially larger.
The change is closely connected to T.S. Lines’ strategy of increasing the proportion of owned tonnage. When charter markets are strong, liner operators face higher hire rates as well as restrictions involving charter periods, delivery windows and vessel specifications. Ownership requires significantly more capital, but it fixes a larger portion of long-term capacity costs and reduces the risk of having to secure ships at the top of the charter cycle.
In its newbuilding announcements, T.S. Lines has explicitly identified lower unit operating costs and reduced exposure to charter-rate fluctuations as strategic reasons for expanding its owned fleet. The first-half margin improvement provides early evidence of that strategy feeding through to the income statement.
Vessel charter hire income moved in the opposite direction, falling about 28% from US$58.9 million to US$42.4 million because fewer ships were chartered out. For a company that both operates liner services and leases vessels to third parties, this suggests that some capacity has been redirected from earning charter income to supporting its own network. The decline reduced other income, yet the combination of higher liner revenue, lower slot costs and greater control over deployed capacity improved group-level gross profit.
Whether redeploying vessels from chartering to liner operations will continue to generate superior returns depends on freight rates remaining sufficient to cover fuel, ports, container management and network operating costs. During the first half of 2026, the adjustment produced a positive result.
Asia remained the foundation, while the Middle East, Mexico and Red Sea lifted yields
Asia-Pacific remained the core of T.S. Lines’ business. Revenue from services in the region was approximately US$484.0 million, equivalent to 80.6% of container shipping revenue. Volumes increased 2.1% to 752,020 TEU, but average revenue per TEU declined from US$663 to US$644, leaving regional revenue 0.9% lower year on year.
Revenue from intra-Greater China and Asia-Indian Subcontinent services increased by approximately 13.7% and 6.5%, respectively, but those gains were offset by weaker revenue on Greater China-North Asia, Greater China-Southeast Asia, Northeast Asia-Southeast Asia and Asia-Oceania routes. The carrier moved more boxes within its principal regional market but earned less per unit, illustrating the pricing and supply pressure still present in intra-Asian trades.
The rise in group-wide average revenue per TEU was driven largely by medium- and long-haul services. Mexico route revenue increased from approximately US$5.0 million to US$15.7 million, while Middle East revenue surged 130.1% to US$77.4 million. A newly launched Red Sea service contributed 7,545 TEU and about US$13.0 million of revenue. Based on the figures disclosed by the company, markets outside Asia-Pacific accounted for only about 7.3% of group volume but approximately 19.4% of container shipping revenue.
Revenue per TEU is naturally higher on longer routes, although the comparison cannot be translated directly into margins. Longer voyages also involve greater fuel consumption, more ship days, higher port costs and, in some markets, additional war-risk insurance and diversion exposure. The strategic contribution of these services lies in raising the revenue ceiling of the overall network and reducing dependence on the freight cycle of a single regional market.
At the end of June, T.S. Lines operated 47 services, excluding business associated with chartered-out vessels. These comprised nine independently operated services, 25 joint services, 11 slot-exchange services and two slot-charter services, covering 21 countries and regions and approximately 59 ports.
This cooperative structure allows a carrier with roughly 140,000 TEU of total fleet capacity to expand coverage without carrying the capital burden of operating every route independently. Asian services provide cargo density, sailing frequency and a broad customer base, while the Middle East, Red Sea and Mexico support revenue diversification. Joint services, slot exchanges and purchased capacity lower the initial tonnage requirement for entering new markets. A wider network also increases operational complexity, making schedule reliability, empty-container repositioning, port connections and cross-regional capacity balancing more important to earnings quality.
The US$232.6 million profit included a US$39.4 million vessel-disposal gain
The 23.3% increase in profit attributable to shareholders cannot be assigned entirely to the liner operation. T.S. Lines recorded a gain of approximately US$39.4 million from the disposal of two vessels, compared with virtually no such gain in the first half of 2025. At the same time, the company moved from a net foreign-exchange gain of about US$12.2 million in the prior-year period to a net foreign-exchange loss of US$3.6 million.
The two items worked in opposite directions: vessel sales materially lifted reported profit, while the change in foreign exchange reduced the year-on-year result by almost US$15.8 million. Net other gains ultimately increased from US$12.3 million to US$36.0 million.
Excluding only the 2026 vessel-disposal gain, first-half pre-tax profit would have been approximately US$193.6 million, around 2.4% above the US$189.1 million reported a year earlier. If vessel-disposal and foreign-exchange results are excluded from both periods, an indicative adjusted calculation shows pre-tax profit rising from roughly US$176.9 million to US$197.2 million, an increase of approximately 11.4%.
These are analytical calculations rather than alternative performance measures published by the company, but they help separate recurring improvement from accounting gains. The underlying business still strengthened, although by less than the headline 23.3% increase in attributable profit. The US$40.4 million increase in gross profit and the stability of administrative and other operating expenses at approximately US$18.6 million support that conclusion.
Profit attributable to shareholders also exceeded gross profit because of the company’s income classification and exceptionally low tax charge. In addition to US$167.5 million of gross profit, T.S. Lines recorded US$50.1 million of other income, including US$42.4 million of vessel charter hire and US$6.6 million of bank interest, as well as US$36.0 million of net other gains. After administrative expenses and finance costs, pre-tax profit reached US$233.0 million.
Income-tax expense was only US$296,000. The company said its Hong Kong entities had no assessable profit subject to Hong Kong profits tax or had sufficient unused tax losses to offset estimated assessable profits, while management assessed its exposure to the global minimum tax regime as immaterial. Any assessment of the 35.2% attributable profit margin should therefore distinguish liner gross profit, vessel charter income, asset-disposal gains, interest income and tax effects.
A high proportion of owned tonnage has become the cost base of the business
At the end of June 2026, T.S. Lines’ fleet comprised 47 vessels with aggregate capacity of 139,743 TEU and an average age of approximately 4.8 years. Of these, 35 owned vessels with capacity of 88,714 TEU were deployed in the company’s own operations and had an average age of about 5.2 years. A further seven chartered-in vessels provided 19,707 TEU and averaged 4.7 years of age. Five owned vessels, totalling 31,322 TEU and averaging just 2.2 years, were chartered out.
On that basis, T.S. Lines owned 40 of the 47 vessels and approximately 120,036 TEU, equivalent to about 86% of the total capacity represented in the fleet disclosure. Looking only at the 35 owned and seven chartered-in vessels used in its liner network, owned ships accounted for more than 80% of deployed capacity. This structure gives the carrier stronger protection against charter-market volatility. It also leaves the company more exposed to vessel values, depreciation and capital expenditure over the cycle.
The 7,000 TEU newbuilding TS KELANG was delivered on April 9, and the final ship in the series is scheduled to join the fleet during the second half of 2026. At the same time, the disposal of two vessels generated the US$39.4 million gain, showing that fleet expansion and asset recycling are taking place in parallel.
Younger ships generally offer better fuel efficiency, stronger environmental performance and greater flexibility under tightening emissions regulations. Selling vessels that no longer fit the network can release asset value when secondhand prices are favourable. The interim announcement did not identify the two ships or disclose their carrying values, so it is not yet possible to determine whether the disposals primarily represented routine renewal, market timing or a deeper adjustment of the fleet mix.
A debt-free balance sheet is entering a capital-intensive phase
T.S. Lines remained in a strong financial position at the end of June. Cash and cash equivalents stood at US$559.3 million, up from US$485.7 million at the end of 2025, while net assets reached US$2.19 billion. The company had no bank borrowings, bank facilities or pledged assets. Its gearing ratio, calculated as total bank borrowings divided by total equity, consequently remained at zero.
Capital deployment, however, has accelerated sharply. First-half capital expenditure increased about 137% from US$71.8 million a year earlier to US$170.3 million. Capital commitments rose from US$578.1 million at the end of June 2025 to US$857.7 million a year later, an increase of roughly US$280 million. T.S. Lines has therefore entered a new phase in which a substantial share of the cash accumulated during the strong container markets will be directed towards fleet renewal and expansion.
Disclosed shipbuilding contracts explain a significant part of the requirement. Two vessels ordered at CSSC Huangpu Wenchong were upgraded from 4,300 TEU to 5,300 TEU at a combined price of US$125.6 million and are scheduled for delivery in February and April 2028. Four additional 5,300 TEU vessels, costing US$245.1 million in total, are due between June and December 2028. The six 5,300 TEU ships therefore represent aggregate contracted value of approximately US$370.7 million.
T.S. Lines also contracted two and four 2,900 TEU vessels at yards under Fujian Shipbuilding in November 2025 and March 2026, respectively. The six ships have a combined value of US$252.9 million, with the latest four scheduled for delivery no later than May 2029. According to the 2,900 TEU newbuilding announcement, the carrier has at least twelve 2,900-5,300 TEU vessels due to be delivered principally across 2028 and 2029.
Shipbuilding payments are staged, with roughly half the contract price of the disclosed orders payable on delivery, so the US$857.7 million commitment will not become an immediate cash outflow. Dividend requirements are substantial as well. Trade and other payables at the end of June included US$166.5 million for the 2025 final dividend, while the newly declared interim dividend will require another US$116.6 million. Together, the two distributions amount to approximately US$283.1 million. The June cash balance had not yet reflected payment of the final dividend in July and did not include a liability for the interim distribution.
Over the next several years, operating cash flow, newbuilding instalments and shareholder returns will compete for the company’s liquidity. T.S. Lines has already stated in its shipbuilding announcements that remaining payments may be financed through internal resources, bank loans or other external financing. Zero bank debt remains the current position, but moderate borrowing would be a practical funding option once the newbuilding programme enters its most capital-intensive stages.
From an intra-Asian carrier to a multi-layer network operator
The first-half results illustrate the development path now being followed by T.S. Lines. Its Asian network provides cargo volume, frequent sailings and a durable customer base. A high proportion of owned ships gives the company greater control over long-term capacity costs. Services to the Middle East, Red Sea, Indian Subcontinent and Mexico add higher-revenue medium- and long-haul exposure.
The 2,900 TEU newbuildings are suited to regional trades, feeder operations and selected medium-haul routes, while the 5,300 TEU and 7,000 TEU vessels give the company a platform for longer-distance and higher-volume services. This multi-tier fleet can improve route matching, but it also demands stronger cargo procurement, partnership management and network coordination.
The earnings benefits are already visible in average revenue per TEU and gross margin, while the associated risks are increasing as well. A large volume of global containership newbuildings is due to enter service around 2028-2029, potentially placing pressure on freight and charter rates. Any normalisation of security conditions on major shipping routes could also release capacity currently absorbed by diversions.
Middle East and Red Sea exposure brings higher revenue opportunities but also greater war-risk, disruption and rerouting exposure. A young fleet with a high ownership ratio can reduce charter-cost volatility, but it cannot insulate a carrier from freight cycles, fuel prices or changes in global trade policy.
In the first half of 2026, T.S. Lines turned a 0.9% decline in container volumes into 3.0% revenue growth and used lower costs to lift gross profit by 31.8%. The US$232.6 million attributable profit contained a sizeable one-off vessel-sale gain, so recurring earnings growth deserves a more measured reading. At the same time, US$857.7 million of capital commitments shows that the company is deploying the cash and profits accumulated in recent years to prepare for its next stage of fleet growth.
With the final 7,000 TEU vessel due in the second half of 2026 and twelve 2,900-5,300 TEU newbuildings scheduled principally for 2028-2029, T.S. Lines’ revenue mix, financing structure and market position will continue to evolve. The carrier is building a multi-layer network spanning regional feeder services, medium-haul markets and selected long-haul trades. Its ability to convert the current cost advantage into through-cycle profitability will depend on the pace of vessel deployment, route economics and disciplined capital allocation.

READ MORE
 Finance
Cetus Maritime Advances Oslo IPO Plans with $133.6 Million Seacon Deal
 Finance
Overtaken by Shanghai, How Can London Keep Shipowners and Capital?
 Finance
Shipowners Have Made a Fortune. How Will They Spend It?
 Finance
“We Are Buying Ships”: NORDEN Raises 2026 Profit Guidance for the Fourth Time
 Finance
HEIDMAR - Scaling for Growth: Capitalizing on Favorable Market
 Finance
Shipping’s Risk Equation Is Being Repriced as Finance, Insurance and Contracts Adapt
 Finance
Shandong Shipping and OSM Thome Form Singapore JV
 Finance
From RMB 1.87 Billion to RMB 4.55 Billion: What Changed at COSCO Shipping Energy in One Year?
 Finance
Net Profit Jumps 42% as NJTC Reshapes Its Liquid-Bulk Shipping Network
 Finance