


China’s Trade Is Moving Beyond the US — and Shipping Demand Is Changing With It

H1 2026 container rates surged as the Strait of Hormuz disruption, front-loaded exports and higher fuel costs collided. Behind the short-term freight spike, a deeper shift is taking place in China’s trade routes, export mix and future shipping requirements.
The global container shipping market entered 2026 expecting another year of fleet growth and downward pressure on freight rates.
Instead, the first half of the year was marked by renewed geopolitical disruption, an earlier-than-usual peak season and sharp increases in freight rates across the main east-west trades.
The outbreak of the US-Iran conflict in late February led to a temporary disruption of commercial traffic through the Strait of Hormuz, pushing up oil prices, marine fuel costs and war-risk premiums.
At the same time, expectations of higher US tariffs encouraged importers and retailers to bring forward orders. The traditional summer peak season effectively began in May, tightening vessel capacity and pushing freight rates on the Asia-Europe and transpacific trades to their highest levels since 2025.
By the end of June, the Ningbo Containerised Freight Index had risen 88.3% from the beginning of the year.
However, the significance of the first half of 2026 goes beyond another short-term freight-rate rally.
China’s trade continues to expand even as its direct trade exposure to the United States declines. ASEAN and Europe are becoming more important, trade with the Middle East could recover once regional tensions ease, and Africa is emerging as a longer-term growth market.
This changing geography of trade, combined with China’s increasing exports of vehicles, machinery, batteries, solar products and industrial equipment, is likely to reshape demand across multiple shipping segments.
The future opportunity may no longer be concentrated only in ultra-large container ships operating on a small number of trunk routes. It is also likely to involve more feeder and mid-sized containerships, car carriers, multipurpose vessels, breakbulk ships and project-cargo capacity.
Global growth weakens as manufacturing expands
The first half of 2026 presented a seemingly contradictory picture of the global economy.
Overall economic growth weakened as geopolitical risks, energy-market disruption and inflationary pressures increased. Yet global manufacturing activity continued to expand.
The World Bank’s June Global Economic Prospects report forecast that global economic growth would slow to 2.5% in 2026, the weakest rate since the Covid-19 pandemic.
Growth forecasts were lowered for around two-thirds of the world’s economies. Advanced economies were expected to expand by only 1.5%, down 0.3 percentage points from 2025, while emerging and developing economies faced their weakest per-capita income growth since the pandemic.
Asia, however, remained the main engine of global growth.
At the same time, the average global manufacturing Purchasing Managers’ Index reached 51.9 during the first half, 1.6 points higher than in 2025 and above the 50-point expansion threshold for 11 consecutive months.
Manufacturing is therefore regaining importance as a driver of economic activity after two years in which consumption and services played a larger role.
The rapid adoption of artificial intelligence, growing investment in data centres, computing infrastructure and advanced manufacturing are contributing to higher demand for electronic components, machinery and industrial equipment.
For shipping, this creates both opportunity and complexity.
Manufacturing-led trade generally supports the movement of intermediate goods, components and capital equipment. But the resulting cargo is more diverse than traditional consumer-goods exports and may require a wider range of transport solutions.
Energy prices drive inflation higher
The US-Iran conflict and the temporary disruption of the Strait of Hormuz produced an immediate shock across global energy and commodity markets.
The Reuters-Jefferies CRB Index averaged 354.9 points during the first half, an increase of 17.6% year on year.
After rising moderately in January and February, the index climbed sharply following the outbreak of the Middle East conflict. Large-scale disruption to crude oil supply pushed energy prices higher, with the index reaching a record level in May.
Although commodity prices eased from their peak in June, the index still ended the month 18.7% above its level at the beginning of the year.
Higher energy costs fed directly into consumer inflation, transport costs and monetary policy.
Average consumer-price inflation during the first half reached 3.3% in the United States and 2.5% in the euro area. Energy accounted for much of the increase, while core inflation remained comparatively stable.
China’s average consumer-price inflation reached 1%, moving back into positive territory and indicating broadly stable domestic demand.
The inflationary effect was also transmitted directly into shipping through higher bunker prices, emergency fuel surcharges, insurance premiums and longer voyage distances.
China’s trade grows despite weak US exposure
One of the most important developments in the first half was the continued expansion of China’s foreign trade despite stagnating exports to the United States.
China’s total goods imports and exports reached $3.67trn during the first six months, up 21.2% year on year.
Exports increased 17.6% to $2.13trn, while imports rose 26.6% to $1.55trn.
The geographical distribution of this growth is particularly significant.
China’s exports to the US increased by only 0.2%, while the US share of total Chinese exports fell to 10.2%, down 0.9 percentage points from 2025.
This suggests that China’s dependence on the US market is continuing to decline.
By contrast, exports to ASEAN rose 22.9%, with the region accounting for 18.6% of total exports. Exports to the European Union increased 16.8%, giving the bloc a 14.7% share.
The Middle East was an exception to this growth trend.
Regional conflict and the disruption of shipping and energy markets weighed heavily on trade. During the first five months, China’s trade with the United Arab Emirates and Saudi Arabia fell by 25% and 6%, respectively.
This weakness appears to be driven primarily by geopolitical disruption rather than a fundamental deterioration in long-term trade potential.
Once regional conditions stabilise, the Middle East is likely to remain an important market for Chinese vehicles, machinery, consumer products, renewable-energy equipment and infrastructure-related cargo.
Africa represents another important longer-term destination.
Trade volumes remain uneven and fragmented across the continent, but Chinese investment in infrastructure, mining, power generation, telecommunications and manufacturing is likely to support the movement of both containerised cargo and large industrial equipment.
China’s export mix is becoming more industrial
China’s export structure is also changing.
Mechanical and electrical products remained the largest export category in the first half, reaching $1.35trn, an increase of 24.5%.
Integrated-circuit exports rose 96.4%, vehicle exports increased 53.9%, and automatic data-processing equipment exports grew 41.3%.
Exports of high-technology products increased 38.5% to $604.2bn.
By comparison, labour-intensive exports grew by only 1.4%, with exports of toys, footwear and several other traditional categories falling by more than 5%.
This change matters for shipping because different goods generate different forms of transport demand.
Integrated circuits and high-value electronics can produce very high trade values without generating equivalent increases in cargo weight or container volumes.
Vehicles, solar modules, batteries, machinery and industrial equipment have a more direct effect on maritime transport demand.
Vehicle exports support demand for pure car and truck carriers, although containers may continue to be used on routes where dedicated ro-ro capacity or port infrastructure is limited.
Solar panels, battery products, electronic equipment and automotive components largely support containerised shipping, while also increasing requirements for dangerous-goods handling, fire safety, monitoring and specialised warehousing.
Heavy machinery, wind-power components, transformers, mining equipment and complete industrial systems support demand for multipurpose ships, heavy-lift vessels, breakbulk carriers and project-cargo logistics.
China’s export growth is therefore creating a broader shipping opportunity than headline container volumes alone would suggest.
Front-loaded exports bring the peak season forward
During the first two months of 2026, the container shipping market continued to display normal seasonal weakness.
Changes to export-tax rebate policies for solar and battery products, uncertainty surrounding US trade measures and the possibility of a partial return to the Red Sea created some disruption, but freight rates on the main east-west routes remained under pressure.
The market changed rapidly during the second quarter.
Expectations of higher tariffs in the US, Brazil, Argentina and other markets encouraged overseas importers and retailers to build inventories before the new duties took effect.
The resulting front-loading of exports brought the peak season forward to May.
The effect was also visible in China-US trade data. Chinese exports to the US increased 35.4% year on year in May and 13.9% in June, despite remaining almost flat for the first half as a whole.
Major Asian ports recorded comparatively strong throughput growth. Container volumes at Shanghai, Singapore and Ningbo-Zhoushan increased by more than 5% during the first five months.
North American ports initially showed weaker results. Throughput at Los Angeles and Long Beach declined slightly during the first quarter as economic uncertainty and cargo diversion affected volumes, before recovering during the May-June front-loading period.
Global fleet capacity continues to expand
The world container fleet exceeded 34m teu by June 2026, an increase of 5.5% year on year and around 700,000 teu higher than at the end of 2025.
Capacity deployment, however, varied sharply between regions.
Capacity on the Far East-Europe trade increased 9.5%, while Far East-North America capacity rose 9.3%.
By contrast, capacity deployed on Middle East routes fell 14.5% as the Strait of Hormuz disruption forced carriers to withdraw or reposition ships and reorganise cargo flows.
Under normal conditions, the continued delivery of new tonnage would be expected to create significant downward pressure on freight rates.
Yet effective capacity remained constrained.
The Red Sea remained unsafe for many operators, meaning a large proportion of Asia-Europe services continued to sail around the Cape of Good Hope.
Longer voyages absorbed ships and containers, while front-loaded demand, port congestion, higher fuel costs and carrier pricing measures further tightened available capacity.
The result was a market in which nominal fleet capacity continued to grow, but usable capacity on several important trades remained restricted.
Freight rates climb across the main trades
The Ningbo Containerised Freight Index averaged 1,396.9 points during the first half, up 16% year on year.
After falling during the traditional January-February slack season, the index began to rise in March as disruption in the Middle East pushed freight rates sharply higher.
From late April, expectations of higher tariffs and rising bunker costs drove further increases on the main east-west trades.
By June 26, the composite index had reached 2,440.2 points, up 88.3% from the beginning of the year.
Europe
Asia-Europe demand remained weak during the first quarter, while CMA CGM, Maersk and Hapag-Lloyd explored a gradual return to the Red Sea.
The outbreak of the US-Iran conflict in March reversed this trend. Security risks increased, leading major carriers to resume diversions around the Cape of Good Hope.
From May, stronger cargo demand and higher fuel costs tightened capacity and pushed rates higher.
By the end of June, freight rates to Europe had reached $5,990 per feu, an increase of 94.7% from the beginning of the year.
North America
Rates on the transpacific declined during the first quarter as available capacity exceeded demand.
Following the outbreak of the Middle East conflict, carriers announced additional fuel surcharges. Because new or increased surcharges on US-bound cargo generally require advance notice before implementation, the rate increase began later than on the Europe trade.
The sharpest rise occurred from late May, when fuel surcharges coincided with the arrival of front-loaded cargo.
By June 26, rates to the US east coast had reached $7,250 per feu, while west coast rates stood at $6,030 per feu.
These levels represented increases of 96.7% and 107.4%, respectively, from the beginning of the year and were broadly in line with the 2025 peaks.
Middle East
The Middle East trade experienced the most extreme disruption.
Higher demand ahead of the end of Ramadan coincided with restrictions on traffic through the Strait of Hormuz, creating a severe imbalance between cargo and capacity.
Carriers introduced war-risk and emergency fuel surcharges. Forty-foot rates rose more than fourfold during March and briefly exceeded $7,000 per feu.
However, the market was characterised by extremely limited actual cargo movement. Quoted rates increased sharply, while the number of completed shipments declined.
Multimodal and alternative routing arrangements supported freight rates during April and May, but cargo recovery remained limited.
By the end of June, Middle East rates stood at around $6,800 per feu, 147.6% higher than at the beginning of the year.
Southeast Asia
Southeast Asian routes remained comparatively weak during the first quarter as carriers competed aggressively for cargo.
Rates recovered during the second quarter as regional holiday demand, capacity management and congestion tightened the market.
By the end of June, rates on the Thailand-Vietnam trade stood at around $504 per feu, while Singapore-Malaysia rates reached approximately $1,320 per feu.
The stronger increase on the Singapore-Malaysia trade reflected additional transshipment activity and port congestion.
Rates face downward pressure in the second half
The outlook for the second half is less supportive.
The World Trade Organization expects global merchandise trade growth to slow from 4.6% in 2025 to 1.9% in 2026.
The National Retail Federation’s Global Port Tracker also points to softer US import demand, forecasting that imports will fall 8.6% year on year in August to 2.12m teu and decline 2.2% in September to 2.06m teu.
The supply side will become increasingly important.
Global container fleet capacity is expected to grow by 4.1% in 2026. More than 60% of the year’s new containership deliveries are scheduled between June and December.
If Red Sea transits resume at the same time as this new capacity enters service, the release of ships currently absorbed by Cape of Good Hope diversions could create a significant supply-demand imbalance.
Freight rates therefore face growing pressure from several directions.
The cargo surge created by front-loading is likely to weaken after late July. European purchasing activity normally slows during the summer holiday period, while the volume of new orders appears insufficient to support current rate levels.
Fuel prices have already eased from their highs, reducing the cost justification for emergency surcharges.
A gradual restoration of commercial traffic through the Strait of Hormuz would also lower war-risk premiums and put downward pressure on Middle East freight rates.
The most likely base case is therefore a decline in freight rates during the second half, although they may remain volatile and above pre-crisis levels.
Tariffs and geopolitics remain decisive
Two variables will determine whether this downward adjustment is orderly or interrupted by another rate spike.
The first is US trade policy.
The temporary 10% global import surcharge imposed under Section 122 of the US Trade Act of 1974 was due to expire on July 24.
The US Trade Representative has also proposed additional tariffs of 10% to 12.5% on economies deemed not to have adequately enforced restrictions on products associated with forced labour, including mainland China and Hong Kong.
With the US midterm elections approaching in November, further tariff measures cannot be excluded.
Any new tariff deadline could generate another wave of front-loaded shipments, temporarily supporting transpacific cargo volumes and freight rates.
The second variable is the Middle East.
Even if the Strait of Hormuz gradually returns to normal operation, uncertainty will remain over the durability of US-Iran arrangements, the timing of full commercial reopening and the willingness of shipowners and insurers to re-enter the region.
A renewed disruption would again increase bunker prices, insurance costs and voyage uncertainty.
A sustained reopening would remove a large part of the geopolitical premium currently embedded in Middle East and global freight rates.
The Red Sea presents a similar challenge.
Maersk resumed routing its AE15, MEC and WAF6 services through the Red Sea and Suez Canal in early July, while CMA CGM and Hapag-Lloyd have also taken steps towards restoring selected transits.
Competitive pressure may encourage more carriers to follow.
However, the threat to commercial shipping has not disappeared, and the security outlook remains closely linked to the broader Middle East conflict.
A rapid and comprehensive return to the Suez route is therefore far from guaranteed.
China’s changing trade map will reshape fleet demand
The most important long-term conclusion from the first half of 2026 is that China’s maritime trade is becoming more geographically diversified and more industrial in character.
Direct trade with the US is losing relative importance, while ASEAN and Europe are absorbing a larger share of Chinese exports.
The Middle East remains a market with substantial recovery potential once the immediate effects of war ease.
Africa is likely to become increasingly important as Chinese companies expand their participation in infrastructure, energy, mining, manufacturing and logistics projects.
This shift will affect the structure of shipping demand.
Trade with the US and Europe has historically supported highly concentrated, high-volume mainline services.
Trade growth with Southeast Asia, the Middle East and Africa is more fragmented. Cargo is spread across a larger number of ports, many of which have different infrastructure, draft and handling limitations.
This creates additional demand for regional services, transshipment networks and more flexible ship sizes.
Feeder and mid-sized containerships are therefore likely to play a larger role.
The opportunity is not limited to container shipping.
Vehicle exports will support PCTCs. Batteries, solar equipment and automotive components will increase specialised container demand. Machinery, wind-power components, transformers and complete industrial systems will support multipurpose, heavy-lift, breakbulk and project-cargo shipping.
The growth of trade value should not automatically be interpreted as an equivalent increase in cargo volume. High-value, low-volume products such as integrated circuits can lift export earnings without generating large numbers of containers.
Nevertheless, the combined effect of more destinations, more port calls, more transshipment, longer supply chains and a more diverse cargo mix can absorb additional shipping capacity even when global trade growth slows.
China’s future shipping demand is therefore likely to become less dependent on a single market, a single route or a single vessel type.
The next phase of growth will be shaped by a broader network of mainline services, regional connections, feeder trades, ro-ro routes and specialised industrial shipping.
For shipowners, carriers, ports and logistics companies, the opportunity lies in understanding this structural transition before it becomes fully reflected in fleet deployment and newbuilding orders.


READ MORE
 Sustainability
324 days ahead of schedule — another milestone for China’s shipbuilding industry
 Sustainability
The Next Shipping Race Will Be About Who Can Burn Less Fuel
 Sustainability
World’s First Wind-Assisted LNG Carrier Named, Featuring Two 49-Metre Hard Sails
 Sustainability
Chimbusco completes first ammonia bunkering operation
 Sustainability
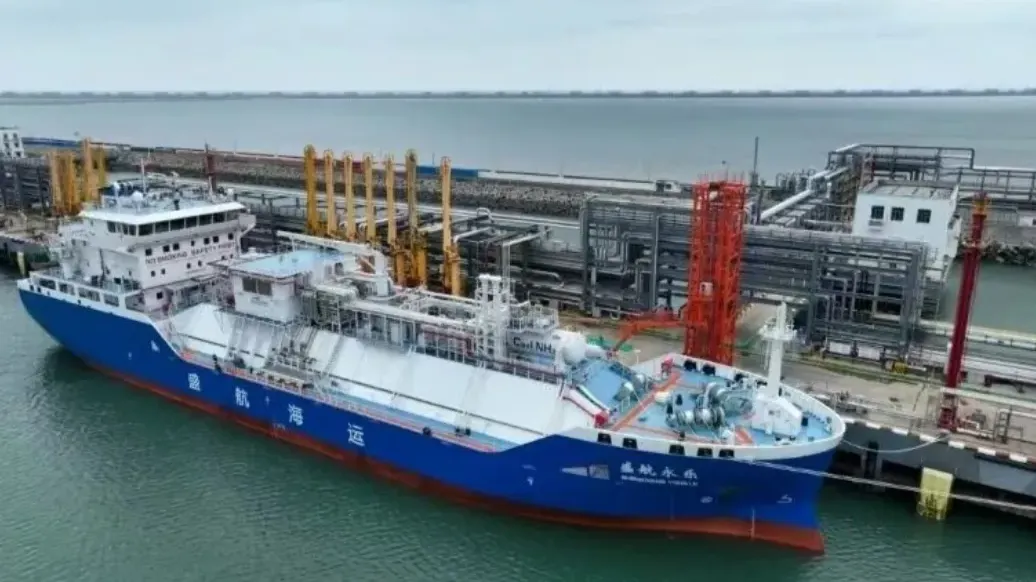
World’s 1st Operational Ammonia Bunkering Vessel Enters Service,Backed by CMB.TECH
 Sustainability
At SMM Hamburg I Saw Seven Changes Reshaping Global Shipping
 Sustainability
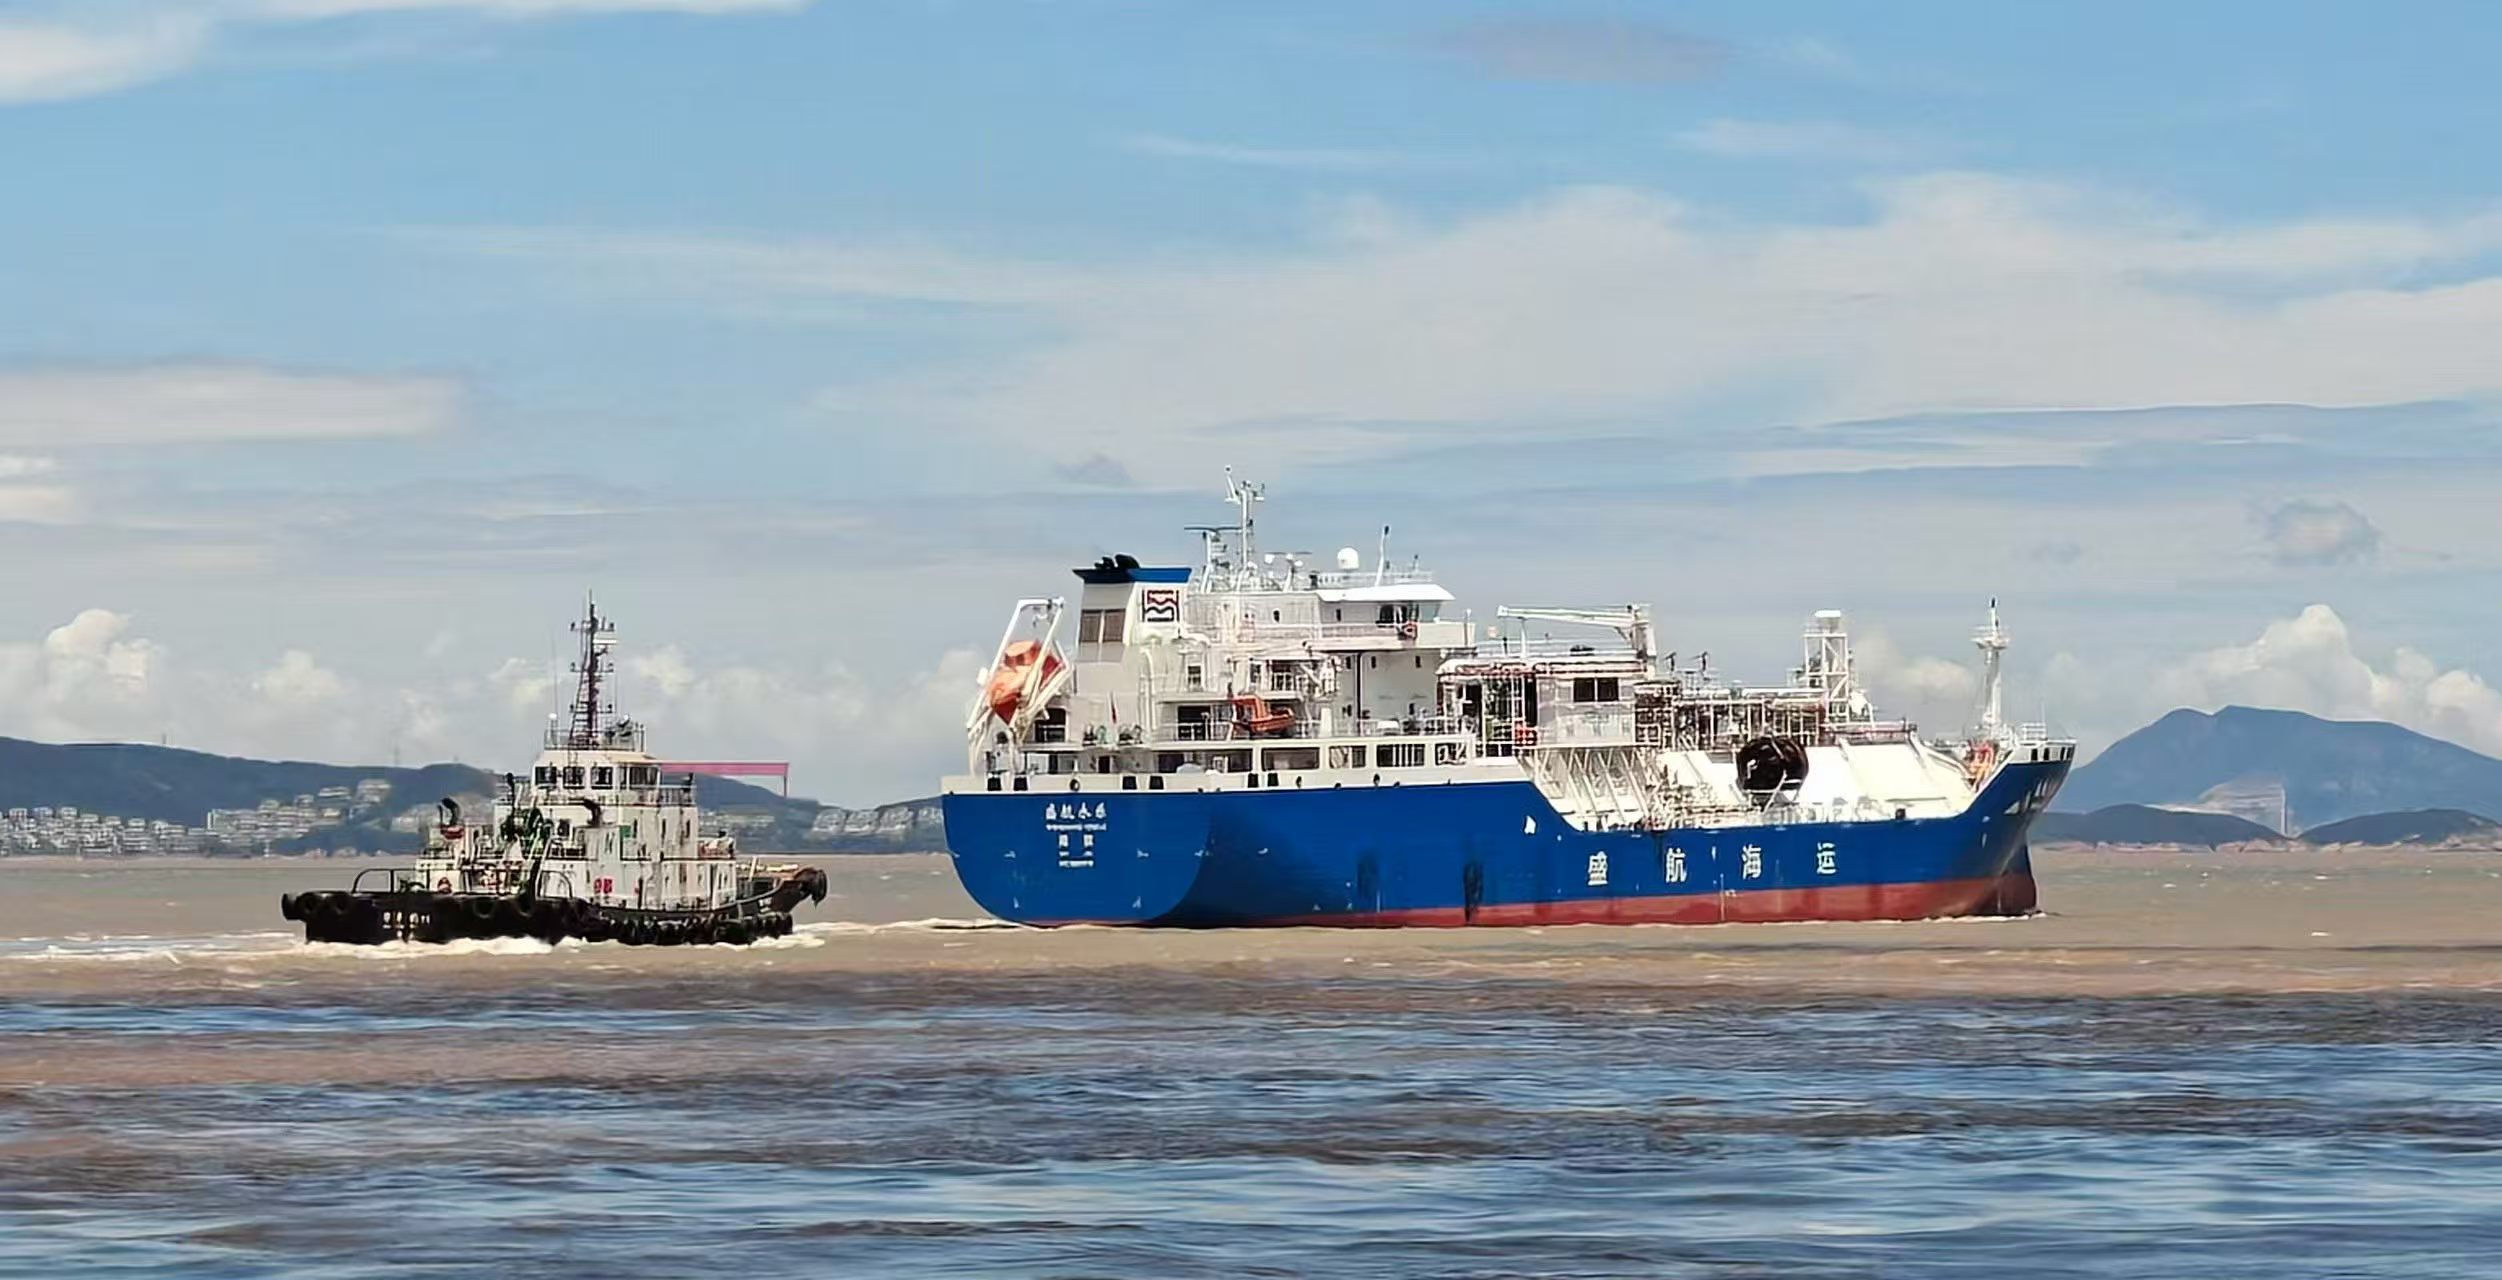
World’s First Operational Ammonia Bunkering Vessel Emerges
 Sustainability
Ships Built Today May Still Be Sailing in 2050 — So How Should We Design Them?
 Sustainability
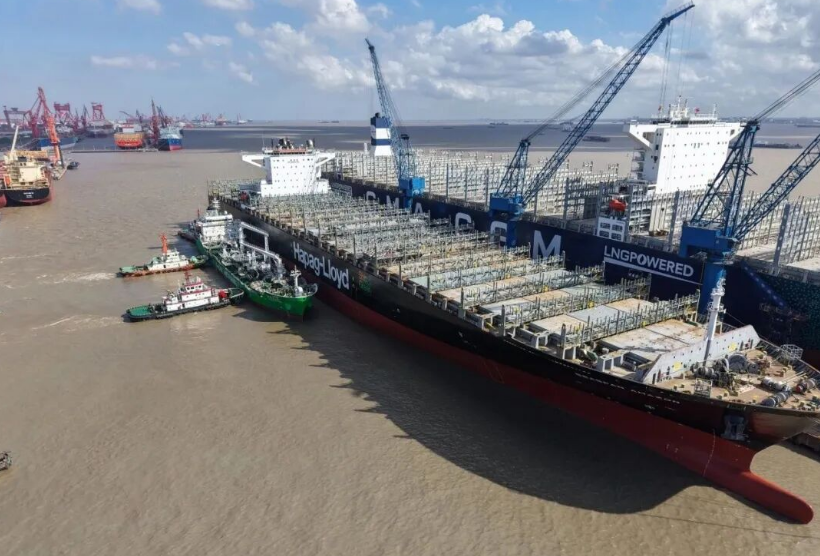
Hapag-Lloyd Completes First Biomethanol Bunkering
 Sustainability