How machine learning can drive smarter decisions in today's shipping markets
By joining the dots in global trade, it is possible to understand how ships perform and how owners deploy them, writes Will Fray, Director, Maritime Strategies International
From trade wars and military conflicts to pandemics and natural disasters, not to mention growing environmental regulations and government interventions, disruptions to supply-chains and global shipping markets have had an enormous impact on freight costs and asset values in the last decade.
Disruptions have primarily impacted the efficiency of the global fleet, through factors such as distances, speed, port days, maintenance schedules and ballast patterns. These efficiency factors are central to MSI's shipping and offshore market models, even if obtaining reliable measurements has been challenging at times.
AIS data holds huge potential to better understand ship trading efficiencies and has been a key data source for MSI's analysis for over a decade. Whilst the proliferation of AIS-based analytical tools in recent years have been mainly focussed on the trade in commodities, MSI's own focus has been to improve our understanding of vessel behaviour.
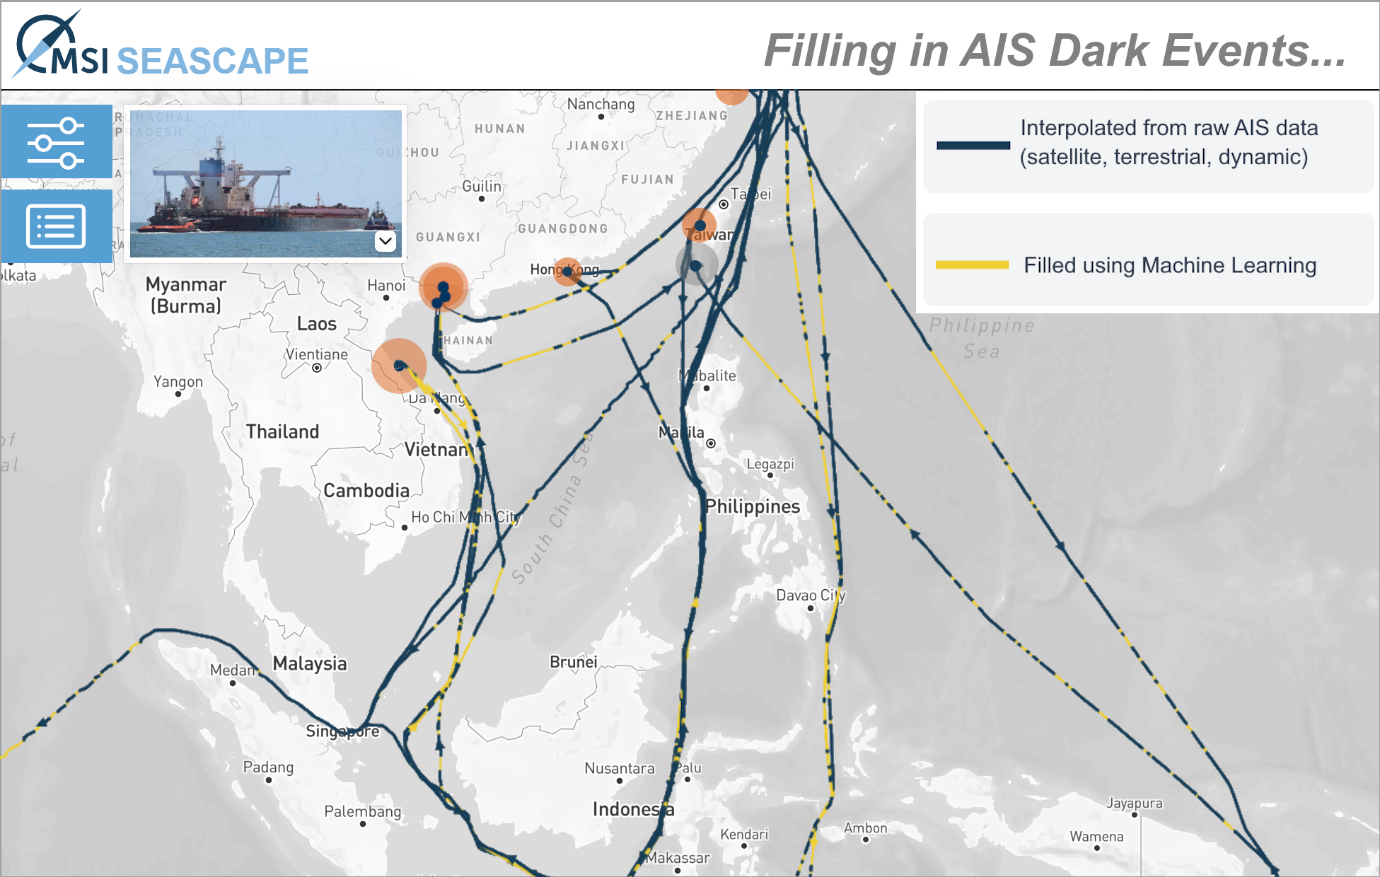
 Figure 1: Using Machine Learning to Estimate AIS Dark Events
Starting with the most comprehensive coverage available of satellite, terrestrial and onboard AIS data, MSI's vessel activity augmentation algorithm fills in the coverage gaps ('dark events'), using historical trading patterns of similar ships to estimate ship positions, speeds and activities. Over two million dark events are identified and filled by MSI's algorithm each month.
As a result, MSI maintains a dataset of continuous hourly ship activity data for over 90,000 commercial marine and offshore vessels, covering not just locations, speeds and headings, but also estimated draughts, cargo loaded, fuel consumption and emissions (the latter closely aligned with the 'bottom up' approach adopted by the IMO Greenhouse Gas Studies). This is combined with our set of over 20,000 tightly-defined berthing and shipyard polygons (itself compiled and maintained using machine learning techniques to discover berths) to identify and define port activity.
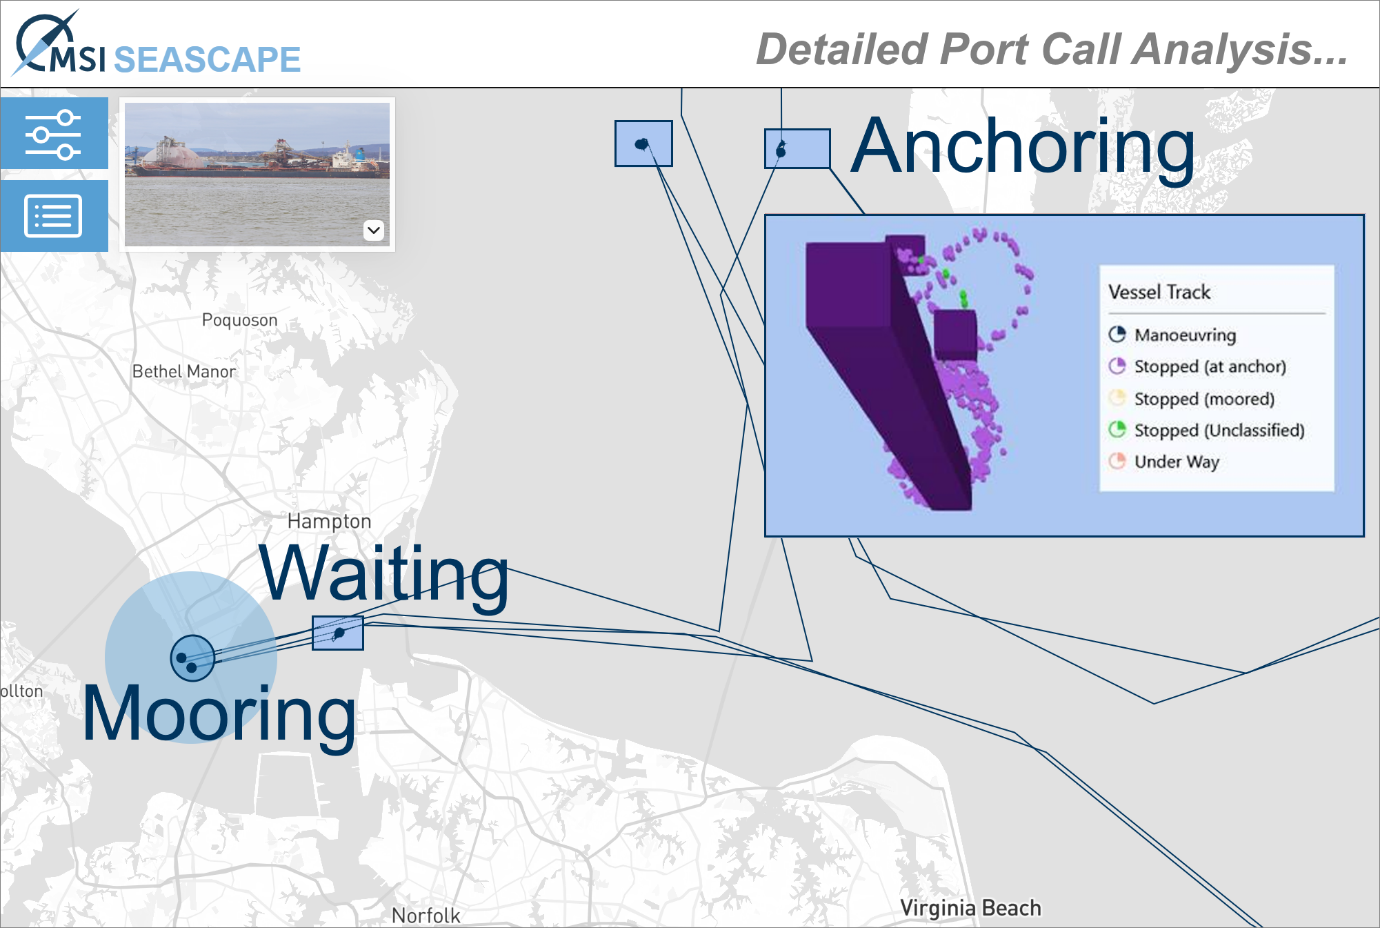
MSI's port call algorithm goes a step further than flagging a port visit and counting the days spent within its limits – port call behaviour is an aggregation of associated stoppages, anchoring, manoeuvring and berthing, even if some of this activity takes place remotely from the terminal itself.
In addition, combining ship and port activity data populates our voyage database, providing valuable insights into the trading behaviour, efficiencies, fuel consumption and emissions estimates at both a vessel and a fleet / owner / portfolio level.
 Figure 2: Detailed Port Call Activity by Component
MSI SEASCAPE
For the first time, MSI is now bringing this augmented AIS dataset to market through our new map-based online platform: MSI SEASCAPE. Also integrated into the platform are fair market values driven by our long-trusted model Forecast Marine eValuator (FMV) and Discounted Cash Flow (DCF) value assessments guided by MSI's expert forecasts for ship earnings, operating costs and future values using our HORIZON market forecasting model.
In total, just over 30,000 vessels are included in the platform at launch, covering dry cargo (dry bulk, containerships, MPP, PCTC) and wet cargo (oil tankers, chemical tankers, LNG and LPG). Insights include ship and fleet deployment patterns and trading efficiencies, emissions and alignment/compliance with CII/Poseidon Principles, ETS and Fuel EU exposure (accounting for both Tank-to-Wake and Well-to-Wake emissions profiles), sanctions monitoring and benchmarking tools to compare vessel operational performance to cohort fleets.
Whilst there are a wide range of applications for MSI's proprietary ship activity dataset, MSI SEASCAPE is aligned with two key purposes: first, benchmarking the activity of existing fleets and vessels, and second, due diligence for acquisition, lending or chartering activities.
SEASCAPE INSIGHTS - Fleet Activity
MSI SEASCAPE can also be used to extract insights for particular sections of the fleet, or groups of vessels by age, size and other characteristics.
For instance, whilst there are strong similarities between the behaviour of the Supramax and Ultramax dry bulk fleets (such as geographical deployment, speeds, ballast ratios), there are some key differences. One significant difference is the time spent at anchor – over the past 12 months, Supramax vessels have on average spent 23% of their time at anchor compared with 17% for Ultramax.
This means that Ultramax vessels have been far more productive, spending 53% of their time at sea vs 46% for Supramax, travelling much further distances (on average 13% further). It is no surprise that the Ultramax fleet has been more efficient from an emissions intensity perspective; on average the CII scores for the Ultramax fleet have been 8.9% below the CII reference line (representing 'Middle C') whereas average CII scores for the Supramax have been only 2.4% below the CII reference line.
SEASCAPE INSIGHTS - Valuation
Analysis by Maritime Strategies International finds that vessels in all shipping sectors have higher fair market value in relation to their discounted cashflow value, suggesting most assets are overvalued against expectations of their future earnings and values.
Using the fleet and portfolio selection tools in its new MSI SEASCAPE platform, it is possible to extract and aggregate MSI's assessment of asset values and investment potential. Fair Market Value is calculated using a dedicated tool while DCF value is arrived at according to MSI’s forecasts driven by its own analysis through the HORIZON forecasting model.
Comparing the two valuations reveals MSI’s assessment of real value; a relatively higher DCF assessment, for instance, flags a buy signal.
In the current market of historically elevated asset values, however, the opposite is more likely to be true. This is certainly shown in the data currently presented on MSI SEASCAPE. The chart illustrates the overall gap between current fleet-level FMV valuations and DCF values as of May 2025, where both metrics represent the combined valuations of the just over 30,000 vessels within each sector on the platform.
All sectors have higher fair market values in relation to their DCF, which suggests that vessels are overvalued when compared with MSI’s expectations for future earnings and values. The divergence between FMV and DCF is largest among the dry bulk fleet, with vessel fair market valuations being over 25% higher than MSI’s DCF value on average.
This divergence suggests that market sentiment and forward-looking expectations are more positive for this sector than for others, when compared to the MSI Base Case.
 Figure 3: DCF Discounts to Fair Market Value
The opinions expressed herein are the author's and not necessarily those of The Xinde Marine News.
Please Contact Us at:
media@xindemarine.com


