.gif)
Some 13.7 million TEU were shipped globally in September, bringing the full year total up to 125.2 million TEU. While that is an improvement of 4% for both the month (year on year) and year to date, the growth rate has been slowing for the past six months (source: CTS).
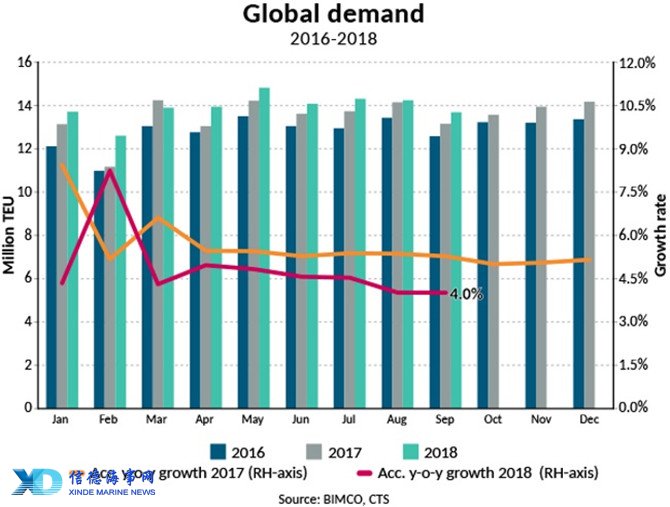
We have seen solid growth rate on the Far East to Europe trade lane during the peak season. Volumes reached an all-time high in Q3 – 6% higher than in Q2-2018, and 2.5% more than in Q3-2017. For the volumes being shipped year-to-date, demand nevertheless remains very low, growing by just 1.7%.
The other significant long-haul and high-volume trade lane, from the Far East to North America, was much stronger, growing 7% from Q2-2018 and 4.8% from Q3-2017.
The impact of the trade war is also reflected in the latest container shipping data. Global demand is down from Q2 to Q3-2018 by 1.5%. Notably, both European and North American export volumes decreased from the second quarter to the third.
In the largest market of them all in volume terms, Intra-Asian volumes were down by 3.8% in Q3 from Q2 but remain up by 4.6% for the year-to-date.
While spot freight rates out of Shanghai to the US East Coast (USEC) and US West Coast (USWC) have clearly improved in the third quarter, the full year has been quite solid too – up 6.4% and 8.4% respectively. There is a similar story for the more-inclusive China Containerized Freight Index measurement – which also takes long-term contractual rates and more ports into account – with USEC up by 1.3% and USWC by 2.8%.

For spot rates on the Far East to Europe trade lane, it’s been a bad year. On average, a TEU was being transported halfway across the globe on an ultra large containership for just USD 825; at the same time last year, it was USD 898 per TEU. A loss-making and worse level year to date in 2018.
On 24 September, a further 22.4 million tonnes of seaborne containerised goods were impacted as the US implemented tariffs on a USD 200 billion list of goods; that amounted to a further 2.24 million TEU. In total, 3.6 million TEU (10 tonnes/TEU global average) are now officially affected by the trade war.
At BIMCO.org you can always find updated news on how the trade war is affecting the main shipping sectors.
Fleet news
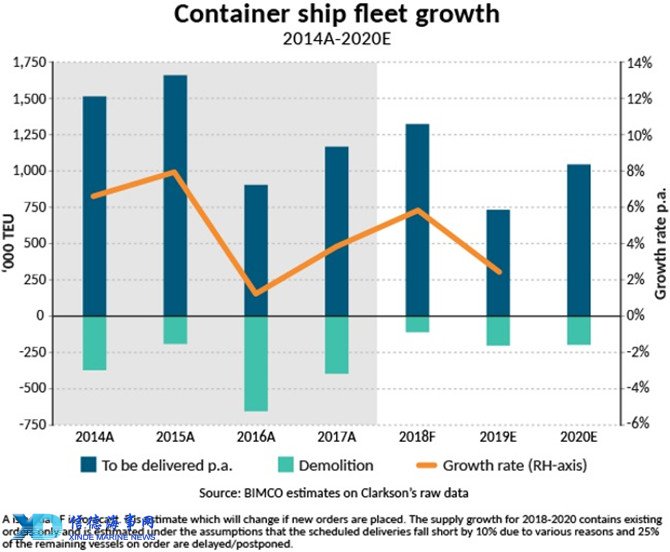
Not since April and September of last year have we seen a similar level of containership demolition. Not that its high in absolute terms, but alone it almost doubles the amount of tonnage leaving the fleet in 2018. Eighteen ships of a combined 33,804 TEU suddenly matter. A 2004-built Panamax stands out, with the rest being 1990s-built feeders with an average capacity of 1,800 TEU.
As the shipyards are generally getting less busy, slippage of the containership order book has also reduced. BIMCO now expects just over 1.3m TEU of new-built capacity to be delivered. This will bring the annual fleet growth in 2018 up to 5.8%, with a year-to-date expansion of 5.4%.
The two-pronged trend of deliveries remains strong. The pure split between choosing either a feeder or an ultra-large ship has been exaggerated since 2016.
Only two ships out of the 150 delivered in 2018 so far, have had a cargo-carrying capacity of between 4,000 and 10,000 TEU. In 2017, only 10 of 153 ships were in that range.
The introduction of so many ultra-large containerships into the slow-growing Far East to Europe trade lane, has resulted in depressed spot freight rates all year. Spot freight rates have ranged from USD 584 to 959 per TEU, averaging at USD 825 per TEU.
Orders have been placed for 1,176,000 TEU of new capacity this year so far – 476,000 TEU of it in September when eight 15,300 TEU ships and 12 23,000 TEU ships were ordered in South Korea. Of these, 82% are for ships with a capacity of 11,000 TEU or above, while 18% are for ships carrying 3,100 TEU or below.
The new ships are mostly for delivery in 2020, thereby lifting our forecast above the 1 million TEU mark for that year.
The outlook for fleet growth in 2019, remains manageable at the current level. If the demolition level reaches higher than 100,000 TEU, fleet growth should stay below 3% – half that of this year.
The trade war is firing on all cylinders now. US importers are said to be paying 50% more in tariffs in September compared with the same month last year. Two-thirds of the increase come from containerised goods. In China – where predominantly dry bulk goods are targeted, imports of many commodities have been dramatically reduced. This also goes for the 7.1 million tonnes of imported containerised goods that have been hit by tariffs on Chinese imports.
As the market is clearly in no need of new tonnage, there has been a slide in the rate for chartered tonnage. When measured by the Harpex index, charter rates are almost back where they started in 2018 after the solid lifts of the first four months. Smaller sizes have held on to some of what has been gained, while larger sizes such as 6,500 TEU and 8,500 TEU are now being fixed at rates below USD 10,000 per day and USD 12,500 per day, respectively.
Will this change in the near term? Most likely not. What is needed to stem the drop and lift charter rates again is higher demand from cargo owners. This should, in turn, prompt some operating lines to seek larger ships to charter-in or different ship types than they currently use, to serve their seasonal requirements or a general increase in demand.
At the end of October, the idle fleet accounted for 700,000 TEU (source: Alphaliner).
By examining our fleet-growth estimate alone, 2019 looks like a year in which the fundamental balance can only improve. But the trade war remains the wild card here. Despite talks between the US and China to resolve the dispute seemingly on again, nothing is settled yet.
Source: Peter Sand, Chief Shipping Analyst, BIMCO
Please Contact Us at:
admin@xindemarine.com